July 17, 2012 at 6:56 am, by Carl
Well, though I don’t necessarily fear conflict, I usually work to avoid straying into controversial topics unaware, especially in print on a blog. It’s not that I’m afraid of putting my opinion down in print, but rather that most people are not really willing to listen with an open mind to unpopular positions. At the same time, people don’t read well, or maybe not “deeply” and as such, they sort of read what they want to read, misinterpreting or redefining what has been written. In any case, I wanted to share a contrarian view about the whole “global warming” issue.
Actually, what I wanted to say was there is always a danger about how easily data can be manipulated to make a point. What’s the adage? Mark Twain wrote that British Prime Minister Benjamin Disraeli said “There are three kinds of lies: lies, damned lies and statistics.” Of course, this concept of being able to prove anything with data works both ways….for and against the opinion or issue in debate.
So, both sides of the Global Warming issue can point to data to make their point, like the expert I reference here. Interestingly, though, I almost always hear only from the side claiming that we’ve ruined the planet. Note, I make it very clear that I am NOT a scientist nor an expert in things related to the environment or science. For me, then what that means is I must listen to the various experts with their opinions. One such expert that I read, particularly because he is in the minority on the issue, is Dr. Roy Spencer. One of his latests post about the heat in June is worth reading. If you are a true believer about the global warming thing, then you probably won’t like his thoughts, which he gives away in the title of the post, calling the temperatures “not that remarkable.” Others obviously disagree, but read on.
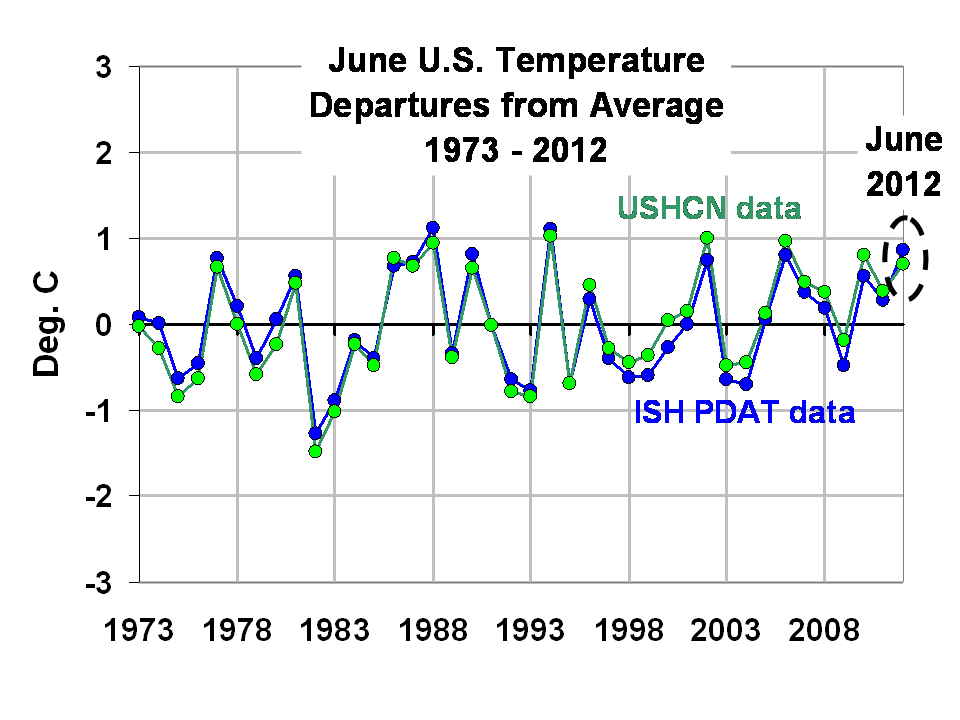
His graph showing the last 40 years from his population-adjusted surface temperature dataset (you can find more about this on his site), and NOAA’s USHCN (v2) dataset (both graph lines are based upon 5 deg lat/lon grid averages), is just one among many from his blog and book that I could show you, indicates at least two points. First, unless someone wants to point out how this graph is flawed or wrong, it sure seems to make the case that while this June is indeed hot, we’ve had several hot Junes since the 1970s. And, we’ve had several Junes that were colder than normal.
Thus, even though some data can be shown on news shows or weather forecasts, unless we have the whole picture, the data can simply be twisted to produce what is wanted; in most cases, what is wanted is to say that humans produce a negative impact on the planet, causing it now to be super hot ruining everything. Note again, as the non-expert, I think humans have made an impact (pretty obviously), and that impact can be negative (all the urban growth around New Orleans, draining the swampy lands where the Mississippi River drains, made Hurricane Katrina worse)…I just don’t believe that we’ve ruined everything.
Therein lies the second point–data can simply be used in multiple ways. So, to our overall point with the blog (How to Live Well), one can choose to use data to convince yourself of anything, but that is not the wisest choice. If you feel negative about a situation, a new job or a new class at school, you can probably produce data to confirm your fears, leading you to get out. Or, if you feel positive about a choice or situation, you can move the data around to support your positive feeling.
What you need to do instead is be willing to allow the data to speak how it does, when it does. Data and statistics is very important to making decisions; have no doubt about that, or that I use data. I do, all the time. But, unless we are willing to approach the issue with our mind open to whatever the data shows us, we can be deceived by the info. If I believe the humans are evil, and have ruined the planet, thus causing global warming, then these hot summer days (and they are really hot, no doubt) will be my evidence. Yet, when I look at the data with an open mind, willing to let the facts speak without embellishment, I see that these hot days seem to be part of natural weather variability (also, knowing history helps because I know that the summers in the 1930s were worse than this, yet in-between then and now, we had what my science teachers were calling the start of a mini-ice age due to excessively cold winters in the 1970s).
Critical thinking is, to me, the willingness to hold one’s opinions lightly. It means that I will eagerly seek to come to the other side of the table, to try to see and hear what those of the opposite opinion are saying. I want to let the data speak for itself, and then allow the facts to be what they are.
It is a hot summer. The data sure seem to indicate that this hot June-July are part of normal weather variability. Be willing to be patient, thoughtful, rather than rushing to some conclusion that might not be in your best interest.


Leave a Reply
Inappropriate or irrelevant comments will be removed at an admin's discretion.